Signal Visualizer

Introduction

Signal Visualizer is a TCP/IP client/server system that uses TCP/IP to display digital DSP signals graphically onto a remote server. The only requirements for the embedded system are : a physical IP interface and a C/C++ compiler that includes a socket API.

A typical system configuration is shown in figure 1.

The benefit of this approach is that while most embedded digital signal processing (DSP) systems do not have access to a video display they do have access to an IP interface to send the data to the server that can display the data.
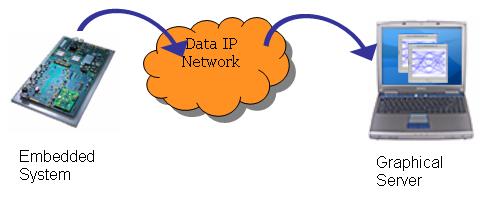
With the ubiquity of the Internet, this project allows an engineer to be able to develop and debug embedded signal processing applications regardless of the location of the embedded system.

This project is based on a final year MEng Undergraduate project at Loughborough University Department of Electronic and Electrical Engineering. It has been released to the open source community under the terms of the MIT license.

Typical System Configuration

Figure 1 – Typical Signal Visualizer System Configuration


Technical Overview

The project has developed a client based library that uses the standard UNIX “sockets.h” API to interface to the packet network. The choice of this API is based on the fact that it is the most standard.

On the server side the project uses the open source wxWidgets API (http://www.wxwidgets.org) to handle both the IP interface and the graphical display. wxWidgets is an open source cross platform development library that allows applications to run under any supported OS (Linux, Windows, Mac-OS etc).

Overlaying the IP interfaces is the Signal Visualizer data protocol which is an implementation of the industry standard XML interface. This was chosen as a clean simple scheme that allows a great deal of flexibility for future expansion while minimizing both complexity and overhead.
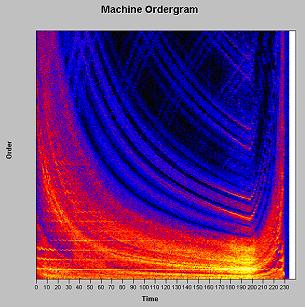
Examples of the use of Signal Visualizer in embedded applications is shown in Figure 2 and 3. 

Machine Ordergram

Figure 2 – An ordergram of a rotating machine (a Rolls-Royce 250-C30P Gas Turbine in a Bell 206 BIII JetRanger) running at variable velocity. This data was transmitted over the Internet from an embedded system and displayed using Signal Visualizer.

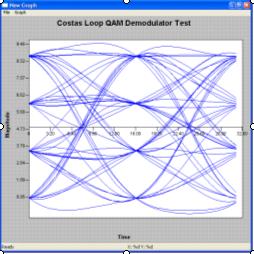
Figure 3 – An eye diagram of a pi/4 DQPSK voice-band modem used in a safety monitoring system.

Figure 4 – Not an embedded system but much more fun :-).

Sourceforge Project Page

http://sourceforge.net/projects/signalvisualize/

Download

http://sourceforge.net/project/showfiles.php?group_id=227651
Please Note - If your Signal Visualizer server crashes under Linux and you receive a "BadAlloc (insufficient resources for operation)" error then this is due to a known xorg-x11-server bug. Please ensure that you have upgraded to the latest version.